Sales Map
The Sales > Sales Map page displays an interactive bubble map for the selected corporate account and/or retailer. This page is only available to Corporate and Lottery users.
 Sales > Sales Map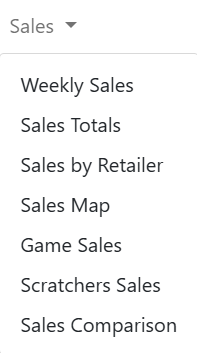
NOTE: To view data, you must select a chain and/or retailer at the top of the page. If you select only a chain, the page displays the details for all of its retailers. You may also need to change the date range, if applicable.
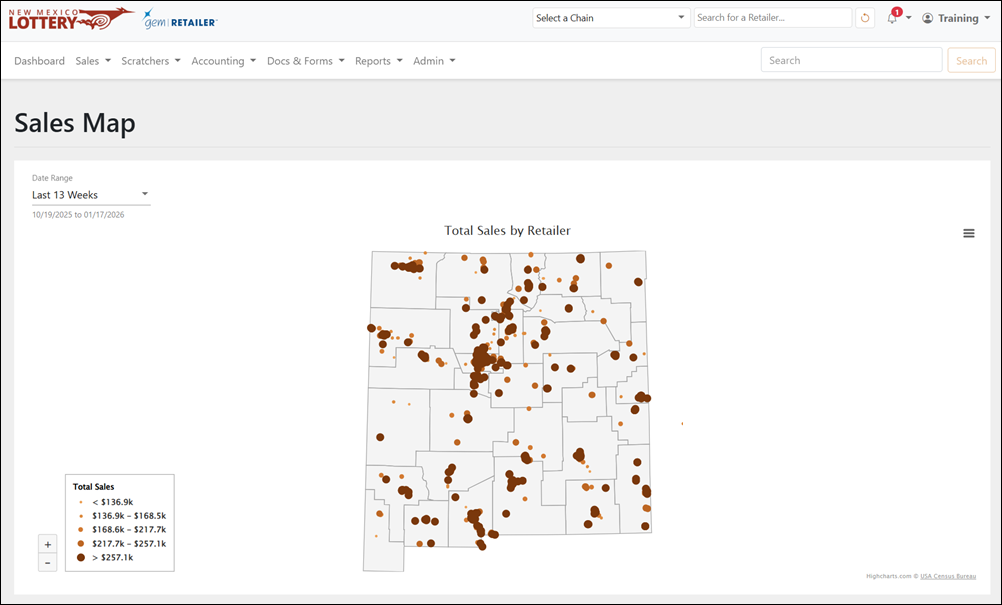
Interactive map
Each retailer under the selected corporate account appears as a point on the map. The size of each point displays total sales for the selected date range. Larger points mean higher sales. Here are some actions you can do:
-
Hover over a point to see the retailer’s total sales amount.
-
Zoom in by double-clicking an area of the map or by using the [+] or [-] buttons in the bottom-left corner.
-
Move around the map by clicking and dragging with your mouse.
Display Sales by Retailer in a Graphic
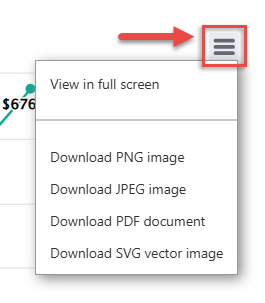
To display sales by retailer in a graphic, click the Chart Context menu on the right-hand side to view in full screen, print the chart, or other graphical download options.